
Building a Hierarchical Spice Cabinet
I love to cook, often without a recipe, and during those times I find myself wanting to assemble a quick melange of complimentary spices to apply to my dish. How can I arrange my spice cabinet so spices that play well together are near each other?
Assuming that complimentary spices tend to be used together, and that dishes with complimentary spices are well reviewed, recipe review data should be able to help me sort my cabinet.
First, the data. I found a free API for recipes that could be queried by ingredient (unfortunately the API has since been discontinued). I wrote a quick library for the API endpoints in Python. Then I wrote a script to walk through a list of 19 common spices and collect recipes as fast as the rate limit allowed. After a week, I walked away with 63k recipes.
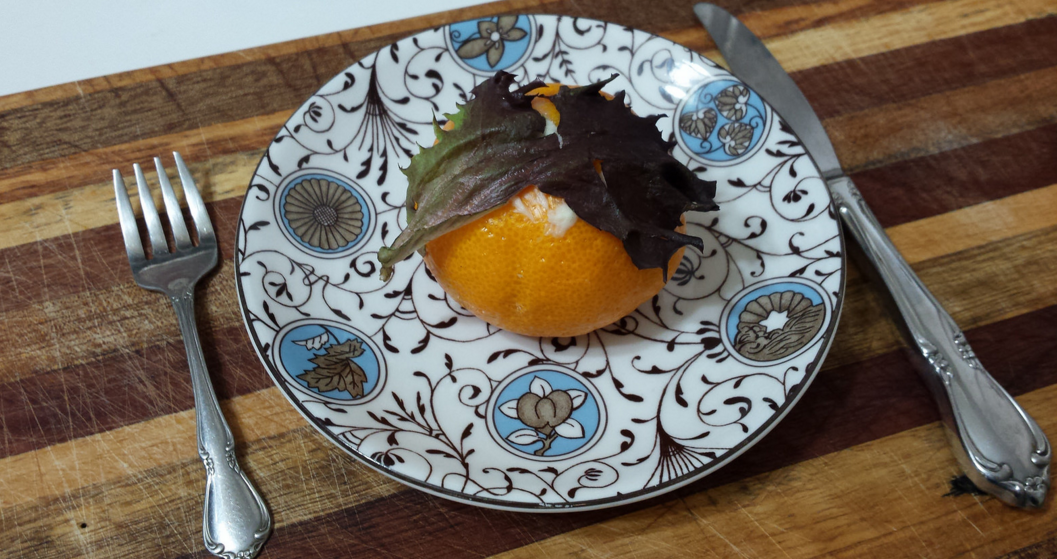
Buttered Orange with Lettuce An inspired dish from my daughter, but not represented in my data
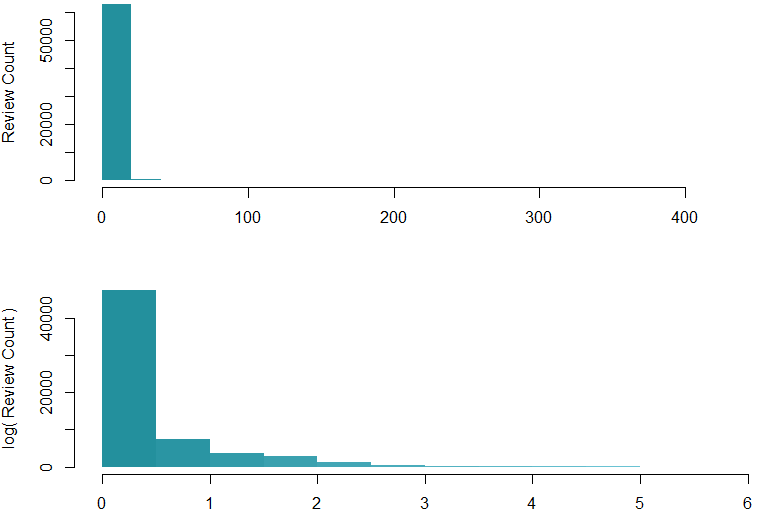
My data contains an average rating and a number of reviews per recipe. The number of reviews follows an exponential distribution, with most recipes having few, if any reviews, but a handful snowball to hundreds of reviews. I would like to use the number of reviews to weight the recipes and their ratings. However, I don’t consider a recipe with 200 reviews to be 200 times as important. To compensate, I am log-scaling the review counts.
hist(fullData$ReviewCount, col=myHeatColorRamp(12),main='',ylab='Review Count',xlab='')
hist(log(fullData$ReviewCount+1, maxReviews), col=myHeatColorRamp(12),main='',ylab='log( Review Count )',xlab='')
The ratings are on a 5-star scale. I am adjusting the scale in two ways:
- Giving a rating to all un-reviewed recipes equal to the mean of my reviewed recipes
- Centering the scale on 2.5 stars, so scores above that count towards a spice pairing and scores below count against a pairing
maxRating = max(fullData$StarRating)
maxReviews = max(fullData$ReviewCount)
fullData$Rating <- fullData$StarRating
# set un-reviewed recipes to the mean of reviewed recipes
fullData$Rating[fullData$ReviewCount<1] <- mean(fullData$StarRating[fullData$ReviewCount>0])
# create weighted scores from zero-centered ratings and log-scaled number of reviews
fullData$weightedRating = (fullData$Rating-2.5) * log(fullData$ReviewCount+1.1, maxReviews)
Now that my scores are adjusted, I need to re-shape my data. I collected my recipes one ingredient at a time and the API only returns the recipe IDs, not full lists of ingredients. To reach a workable data set I need to create columns for each spice and group by recipe IDs.
# create columns for each spice
for(spice in spiceList){
  # weighted score if ingredient was used, otherwise zero
  fullData[,spice] = ifelse(fullData$keyword == spice, fullData$weightedRating , 0)
}

# create spices vs recipes weighted score matrix
recipeMatrix = aggregate(fullData[,spiceList],by=list('recipeID'=fullData$RecipeID),max)
Finally, I can find the correlation between my spices, based on weighted recipe ratings, and generate a hierarchical clustering.
# create spices correlation matrix
spiceCor = cor(recipeMatrix[,spiceList] )

# hierarchical cluster
spicesHclust = hclust(dist(spiceCor))

# display results
plot(spicesHclust)
# cut into 6 pieces
rect.hclust(spicesHclust, k = 6, border=myColors)
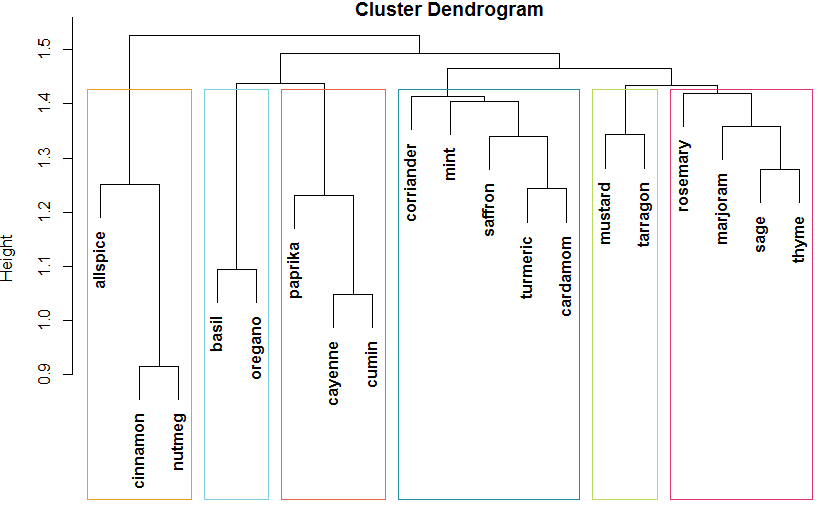
Voila! I have some pretty intuitive clusters here:
- Sweet spices (allspice, cinnamon, nutmeg)
- Garnish herbs (basil, oregano)
- Hot spices (paprika, cayenne, cumin)
- Specialty spices (coriander, mint, saffron, turmeric, cardamom)
- French spices (mustard, tarragon)
- Herbs (rosemary, marjoram, sage, thyme)
I like to give k-means a shot at the problem to validate my results. I will visualize k-means with PCA.
spiceKmeans = kmeans(spiceCor,6,nstart=10)
# display results, using PCA to compress dimensions
spicePCA = prcomp(spiceCor)
plot(spicePCA$x[1:numSpices],spicePCA$x[(1:numSpices)+numSpices],pch=19,col=myColors[spiceKmeans$cluster], cex=5, lwd=5, xlab="First Principle Component", ylab="Second Principle Component")
text(spicePCA$x[1:numSpices],spicePCA$x[(1:numSpices)+numSpices]-0.02, colnames(spiceCor))
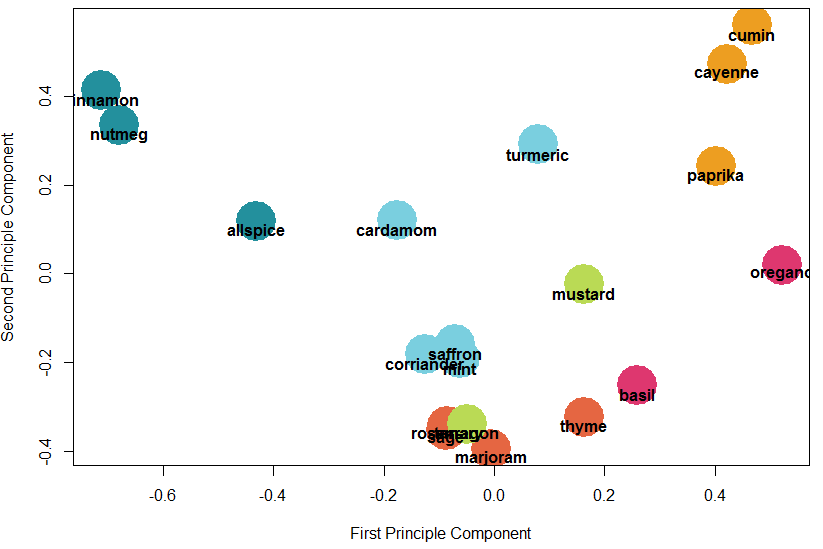
Given a K of 6, k-means develops exactly the same grouping! PCA does reveal some similarity between the herb, French, and specialty clusters.
I took things a few steps father by creating an algorithm to find a shortest path that connects the spices without repeating. Tracing the path would be a form of ideal layout in my cabinet. Lastly, I used the top 3 PCA dimensions to plot this path and animate it:
He who controls the Spice, controls the universe!
–Baron Harkonnen